

A dot appears on a map near your home. Where does crime map data come from? Police agencies record calls and incident reports, then publish them through open data portals or submit them to state and federal systems such as NIBRS.
The route from a phone call to a dot has several hand-offs, and each one affects what you see. If you are new to reading these maps, start with our guide on how to use a crime map, then come back here to see what sits behind the dots.
From call to dot: following one incident
A dot on a crime map is the last step of a records chain that begins with a person asking for help or an officer noticing something. Each stage adds detail and removes some, so the dot is a simplified picture of the original event.
The call for service
Calls for service are the requests that reach an agency’s dispatchers and get logged with a time and place. A call is a report of something happening, not a finding that a crime occurred, and many calls never become crime records. Which agency logs the call matters more than most map readers expect. ABC7 notes that a single drive in Los Angeles County can take you through about 10 different law enforcement jurisdictions, each with its own records.

The incident report
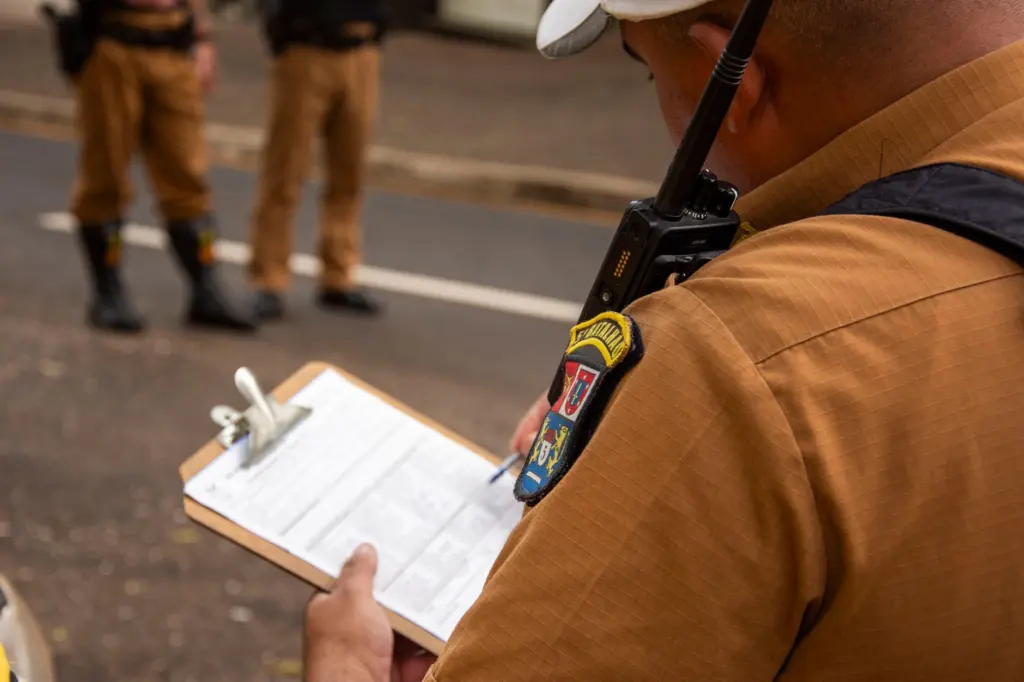
When an officer concludes that something reportable happened, the details go into an incident report. This is the record most crime maps are really drawn from. It fixes a category, a location and the people and items involved, and it replaces the raw urgency of the call with structured fields an analyst can count.

Publication and the dot
The agency then sends its records on. Some go to an open data portal that anyone can download from. Others go to a state justice department or the federal system, which standardise the numbers and publish them later. A map site or app reads one of those outputs, places each record at its address or block, and draws the dot. The next sections look at each hand-off in turn.
What an incident record actually contains
An incident report entered into an open dataset holds more than a category and a pin. According to ABC7, open data includes information on victims, weapons and locations for each crime. Public maps usually show only a small part of that, typically the offence type, the date and an approximate position.
Records also change after they are first written. ABC7 reports that a department will go back years to update specific cases as they learn more. A dot you saw last month can therefore be recategorised, which is one reason two snapshots of the same area can differ.
Common misunderstandings about crime map data
Most confusion comes from treating a map as a live, complete and single-source feed. The table contrasts the usual assumptions with how the data behaves.
| Common assumption | What the data does | Planning use |
|---|---|---|
| Every dot is a confirmed crime | Dots come from agency records, and agencies revise older cases as they learn more. | Treat a recent dot as provisional. |
| Maps show events as they happen | Static agency reports often lag the crimes they describe by months to years. | Check the map’s own data page for its stated coverage. |
| One national database feeds every map | Local agencies, state justice departments and federal systems each publish their own versions. | Note which agency the map credits. |
| The map lists every record in view | A public map can stop at a cap, such as a maximum record count of 500. | Zoom in or narrow dates if a cap message appears. |
The lag and revision points come from ABC7’s explanation of how crime data is collected, and the record cap is shown on a public agency crime map.
- A dot is not a verdict. It marks a reported incident at the time it was recorded, so use it to spot patterns rather than to judge a specific address.
- Missing dots are not always safe streets. Many local agencies, ABC7 says, simply lack the technology or resources to publish open data, so some areas have thin or no map coverage.
- Different maps can disagree honestly. They may draw on different agencies, different dates or different handling of revised cases.
Open data portals and agency data pages
An open data portal is a public website where an agency or city posts datasets, often incident records, for download or for use by other tools. When an agency has one, it is usually the closest map users can get to the source, because the dataset is the same one the agency’s own staff work from.

Not every agency publishes this way, and national providers fill part of the gap. NeighborhoodScout states that it is collecting the raw crime data from all 18,000 law enforcement agencies in the United States, then assigning reported crimes to the communities where they occurred. It also develops algorithms to statistically estimate violent and property crime incidence. A figure from a service like this may therefore be an estimate built on agency reports rather than a plain count, so read its method note before comparing it with a local portal.
FBI UCR and NIBRS: the federal layer
The FBI’s Uniform Crime Reporting program, or FBI UCR, is the national collection that local agencies feed into. Older UCR tabulations were organised around summary counts, for example the Crime Index tables covering offenses known for cities of population 10,000 and over. That kind of summary is useful for city comparisons but tells you little about an individual incident.
NIBRS, the National Incident-Based Reporting System, is the replacement. ABC7 reports that the federal government announced in 2016 it would retire the old way of submitting crime data, and that starting in 2021 the FBI and the Bureau of Justice Statistics transitioned to only accepting data through NIBRS. The shift matters to map users because incident-level records are closer in form to the reports behind the dots.
The transition left gaps. The same ABC7 report says the NYPD and LAPD had not yet moved to the new system, so they were unable to report 2021 numbers in 2022. If a national chart seems to be missing a big city for a given year, an unfinished NIBRS transition is a plausible reason.
How often crime map data is updated
There is no single refresh schedule. The answer depends on which output a map reads, and the publishing layers differ sharply in speed.
- Static agency reports. ABC7 notes these reports often lag months or years after the crimes occur, so they suit trend questions better than recent-activity questions.
- State standardised figures. In California, agencies report to the state Department of Justice, and those numbers are standardised and published months later.
- Revised records. Whatever the feed, older cases can be changed after new information arrives, so past totals are not permanently fixed.
For recent activity, look for an agency’s own data page and read the dates it states. For long-term comparison, the slower standardised figures are more consistent, which is the better trade for the question you are asking.
What a crime map leaves out
Not all crimes appear on a map. Unreported incidents never enter an agency’s records, and some records are held back or limited by the map’s own settings. The visible example is the display cap: a public map can stop drawing once it reaches a maximum record count of 500, which means a crowded area or long date range may show only part of what exists.
Coverage also depends on who publishes. A map built on one agency’s feed will stop at that agency’s boundary, which is a real problem in regions with many small jurisdictions. For a fuller look at what these limits do to reliability, read how accurate are crime maps. And because raw dot counts favour larger areas, learn how to calculate crime rate before comparing one neighbourhood with another.
Frequently asked questions
| Question | Answer |
|---|---|
| Does a faster map mean better data? | Not necessarily. A quick feed shows records before they have been checked, while slower standardised figures are more settled but arrive months later. |
| Why would a big city be missing from national figures? | It may not have finished moving to NIBRS. ABC7 reports that the NYPD and LAPD could not report 2021 numbers in 2022 for that reason. |
| Why do two maps show different results for the same area? | They can draw on different agencies or dates, and some providers add statistical estimates to reported crimes. A display cap can also hide records. |
| What replaced the old federal reporting method? | NIBRS did. The FBI and the Bureau of Justice Statistics have accepted data only through it since 2021. |